¶ What is Live Mouse Tracker ?
LMT is designed to track mice on the long term. It has been created with on idea on mind: to provide behaviourist a reliable system to annotate automatically what mice are doing in their environment, and what are their social interactions. It is fully described in the publication available at bioRxiv. Now published in Nature biomedical engineering.
Link to official live mouse tracker website Live Mouse Tracker
It is a system that analyzes the behavior of groups of mice in real time using a depth-sensing camera and machine learning.
The authors of this system are : - Fabrice de Chaumont - Elodie Ey - Nicolas Torquet - Thibault Lagache - Stéphane Dallongeville - Albane Imbert - Thierry Legou - Anne-Marie Le Sourd - Philippe Faure - Thomas Bourgeron - Jean-Christophe Olivo-Marin
¶ What behaviours can it extract automatically ?
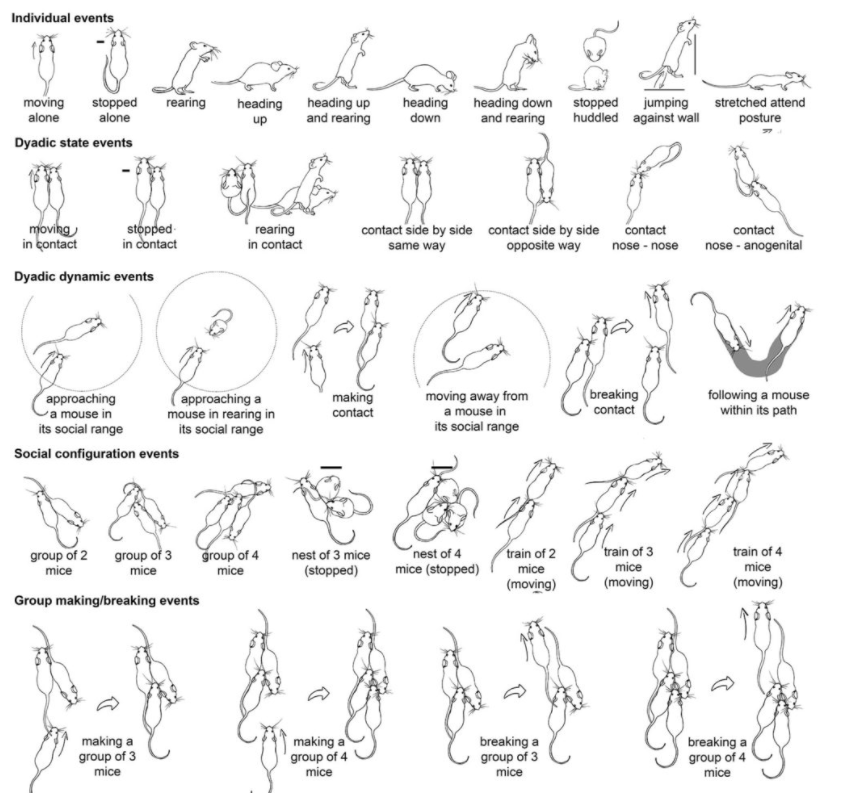
Here is the list of basic behaviours the system can extract (without any manual intervention). Note that you can develop add your own behaviours.
The image below shows us the different behaviors extracted automatically:
¶ LMT Community
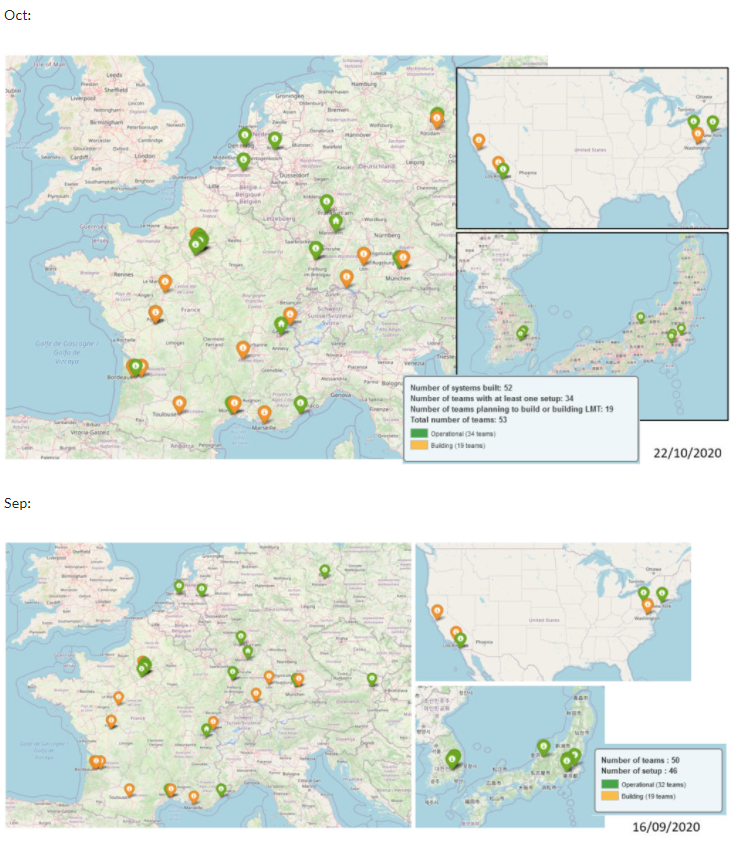
The LMT is used in several countries as shown in the picture below:
¶ Download
The last version of Live Mouse Tracker can be downloaded here.
¶ LMT assembly
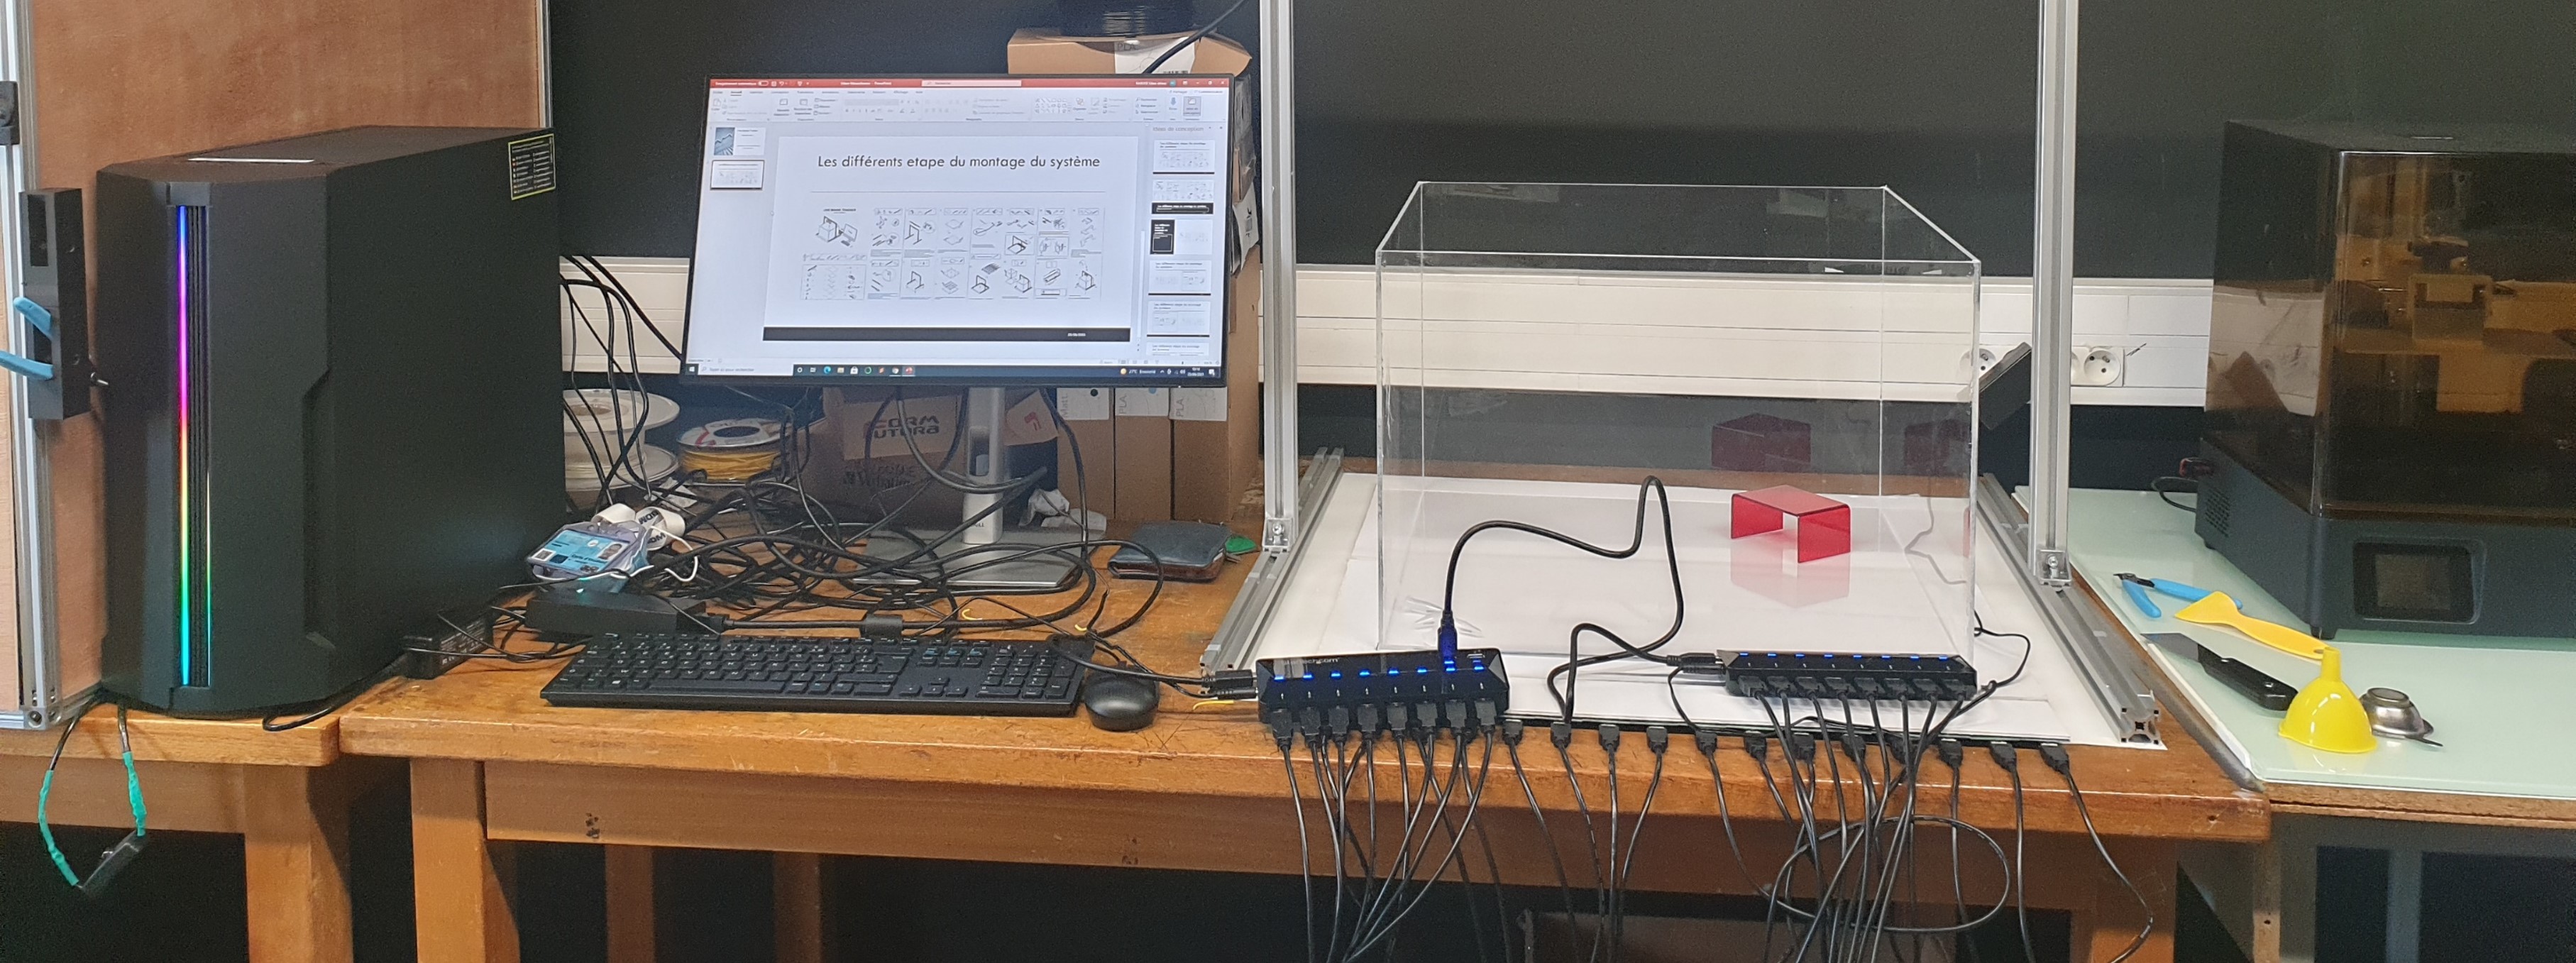
The designers of the LMT system provide a complete list of the parts to be purchased for its assembly and also provide the different steps for the assembly of the system.
Live mouse tracker is a DIY device ! Download the complete shopping list and assembly instructions here.

Final assembly of the LMT below:
¶ System setup
To run the LMT, we need to download the latest version from the official website. The system works on JAVA 8 / 64 bits. Its designers recommend a Ryzen 7 2700X computer with 16 GB of RAM to have good calculation times. The LMT works only on Windows and does not use GPU.
¶ Kinect configuration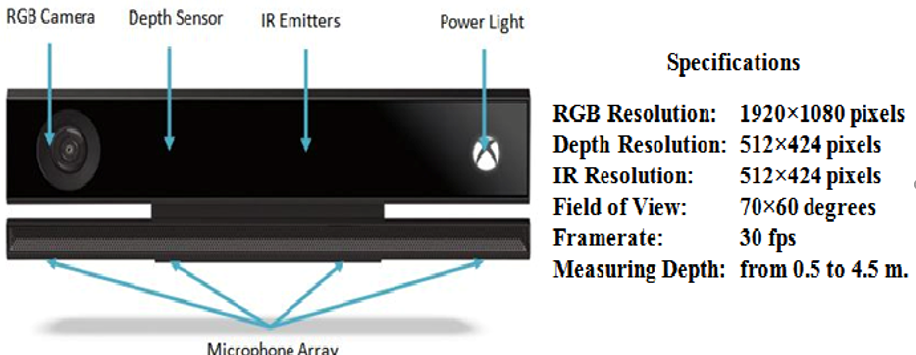
The LMT uses a Kinect version 2 camera for mouse tracking. This camera designed by Microsoft in September 2008 is a depth-sensing device allowing to control an interface without using a joystick. It uses interaction techniques based on an input device connected to the Xbox 360 console that allows interaction by voice command, motion and image recognition. It is equipped with a depth sensor, which allows it to be used in the dark.
Precautions to take to install a Kinect on a computer:
- The Kinect camera is only compatible with computers running Windows.
- The SDK 2.0 is compatible with Windows 10, 8.1 and 8, absolutely in 64bits x64 (for Windows 7 or 32bits OS, you will have to download the SDK 1.8, see below).
- Microsoft recommends a PC with at least a dual core processor, 4GB of RAM, a USB 3.0 port and a DirectX 11 compatible graphics card.
After installing the Kinect, you have to check that it works well. To do this, you need to launch the Kinect configuration program and check that you have an output acquisition speed of 30 images per second. Any non-constant or lower value distorts the data.
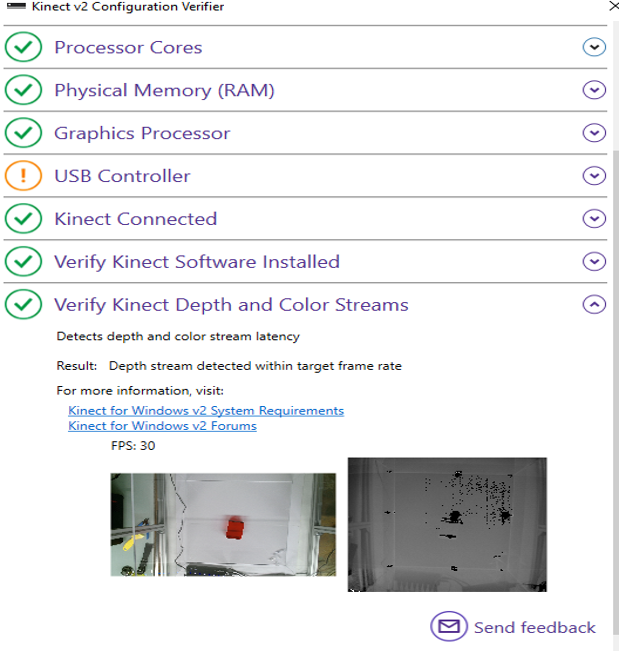
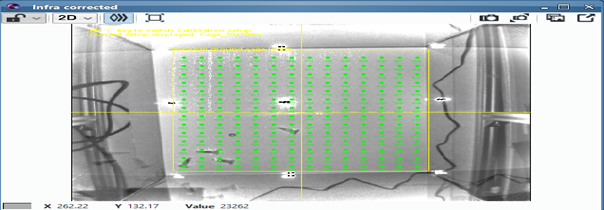
To calibrate the Kinect, we launch the LiveMouseTrackerCalibration plugin in the Live Mouse Tracker tab. LiveMouseTrackerCalibration offers a view on the field with red, orange and green dots. When everything is green, the system is well calibrated.

¶ Setting the antennas
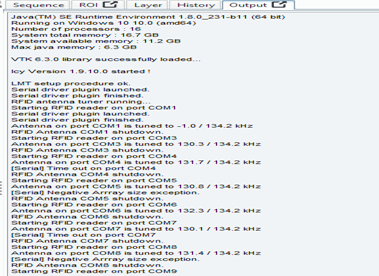
For antenna tuning we launch the AntennaTuner plugin in the Live Mouse Tracker tab.
Then when Icy (suite integrating several applications like LMT, ImageJ, ...) exits, we can see the current setting refreshed every second.
It automatically detects all COM ports when connecting/ disconnecting the antennas.
If we get 0.0 / 134.2kHz this indicates either a broken wire or a problem with the soldering.
¶ How do I insert the RFID probe ?
The RFID should be gently put in the animal using, using gas anesthesia, and local subcataneous analgesia. The RFID should be inserted in the neck and gently pushed on the side of the animal.

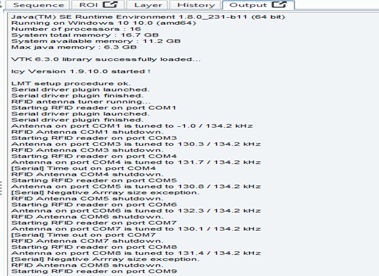
The RFID chip detection test is done with the AntennaTuningTester plugin. For each antenna, during 5 seconds, 10 readings per second for each cycle are performed to finally display the detected RFID number at the output.
¶ Data acquisition
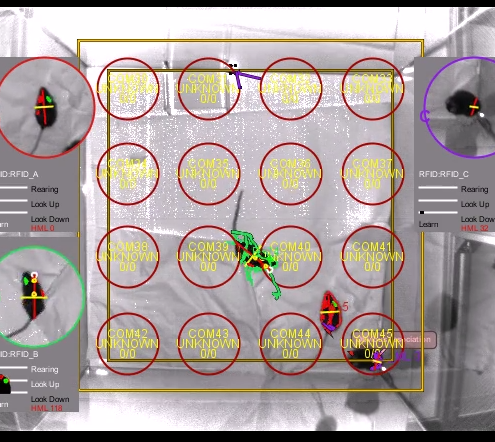
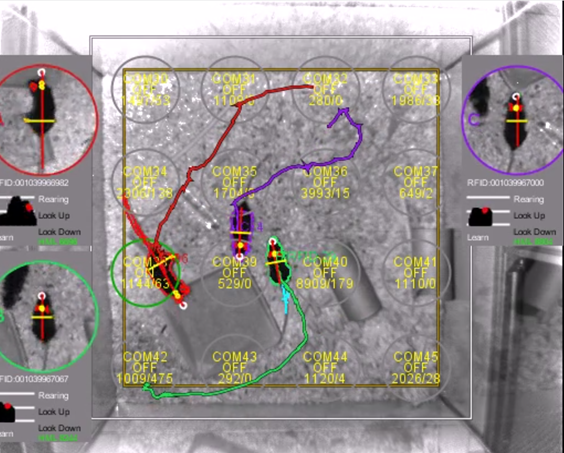
For each experiment, launch the Live Mouse Tracker plugin. Choose the name of the experiment, the number of mice for our experiment and the storage location of our generated data.
![]()
After 20 seconds of observation , the Tracking is now initialized.
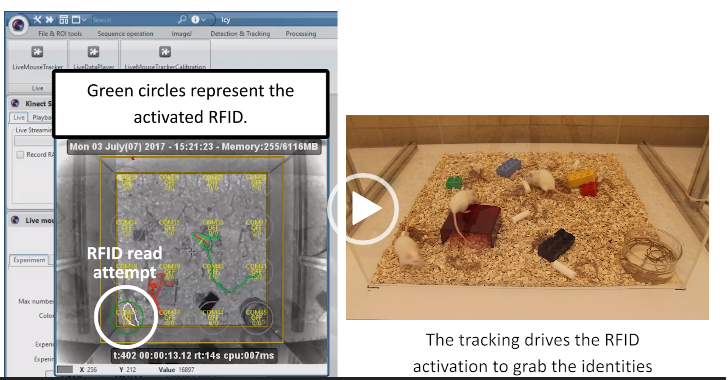
Often our circles do not activate and are red in color.
To solve this problem:
You have to note the antennas according to the number in the picture
so the top left antenna should be antenna 30, then to its right 31 and so on
To change the number of the com port, go to the properties of the com port, advanced, and change its number (from the device manager)
LMT produces a set of data:
- A database file, in the SQLite format, which is handy as SQLite database are standalone files, which avoid using server. You can just copy/backup/restore/share your databases as easy as manipulating conventional files.
- A set of video, in the MP4 format, which store the view in LMT. The purpose of those video is to get back to the film if you find specific behaviour while digging in the data. To find back a specific event, we hard coded in the video the current frame and current date/time. MP4 files are split in 10 minutes segments so that you can play MP4 even during the experiment.
- A background view folder, which store the depth image of the cage, without the animals. This is great to study how mice are moving objects in the cage, how they organize their nest or how they move/eat their food.

¶ Data analysis
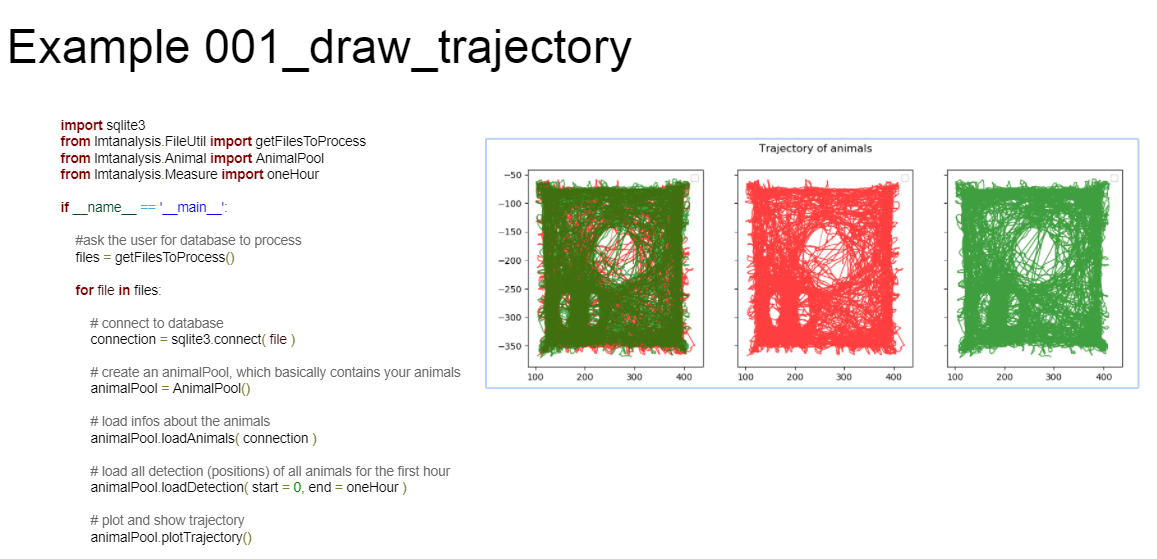
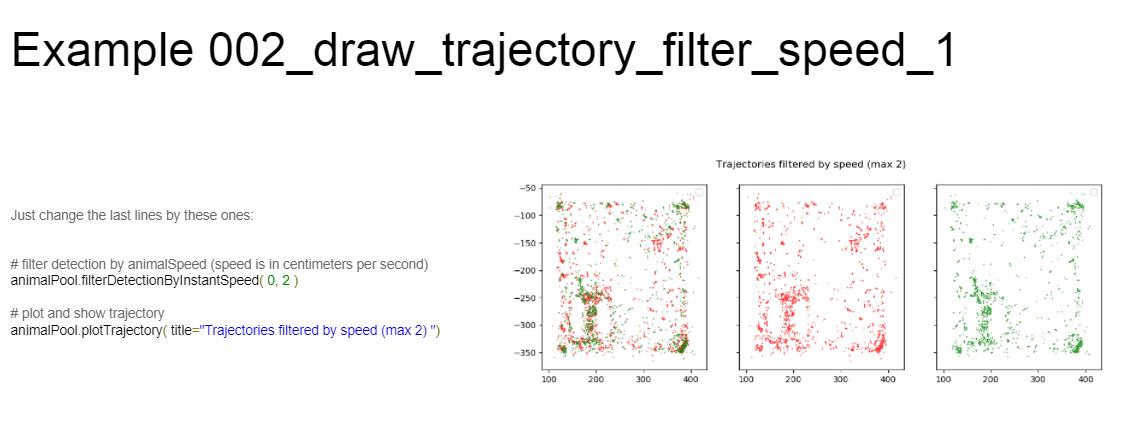
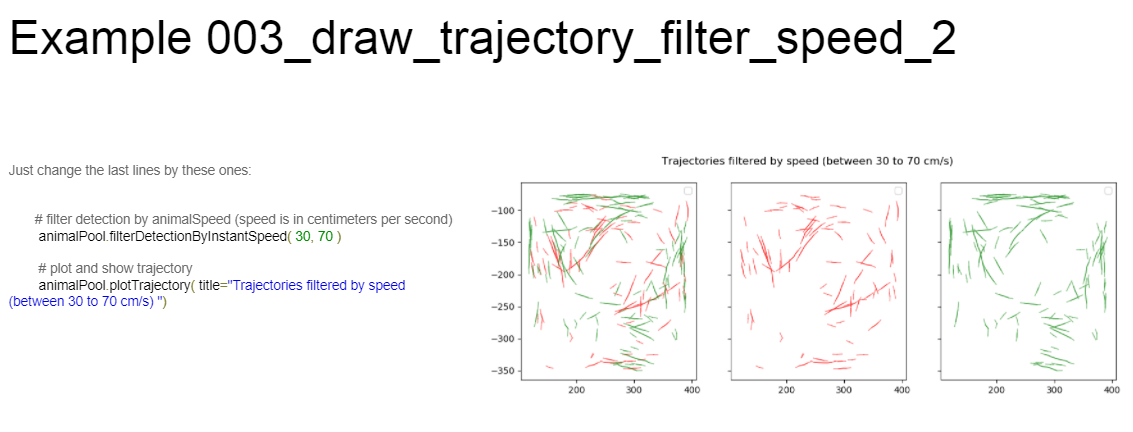
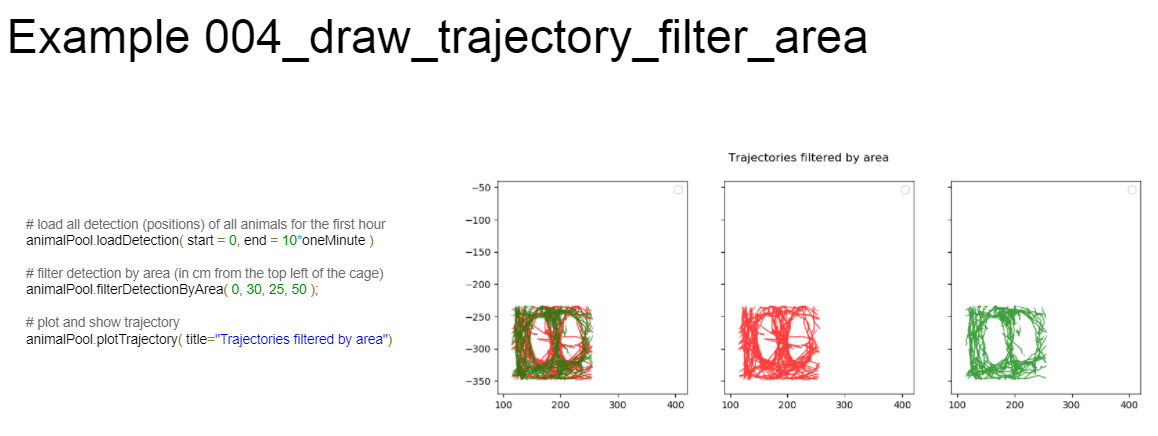
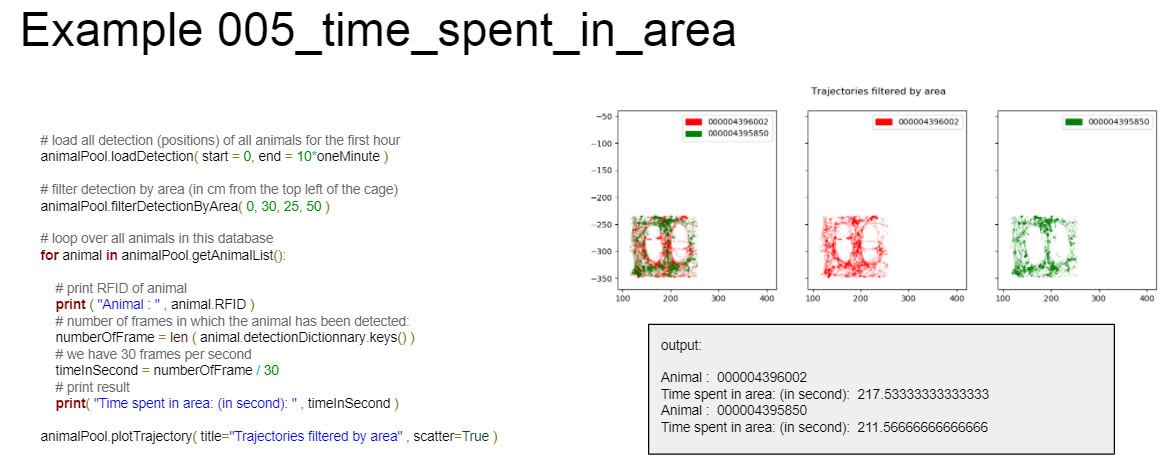
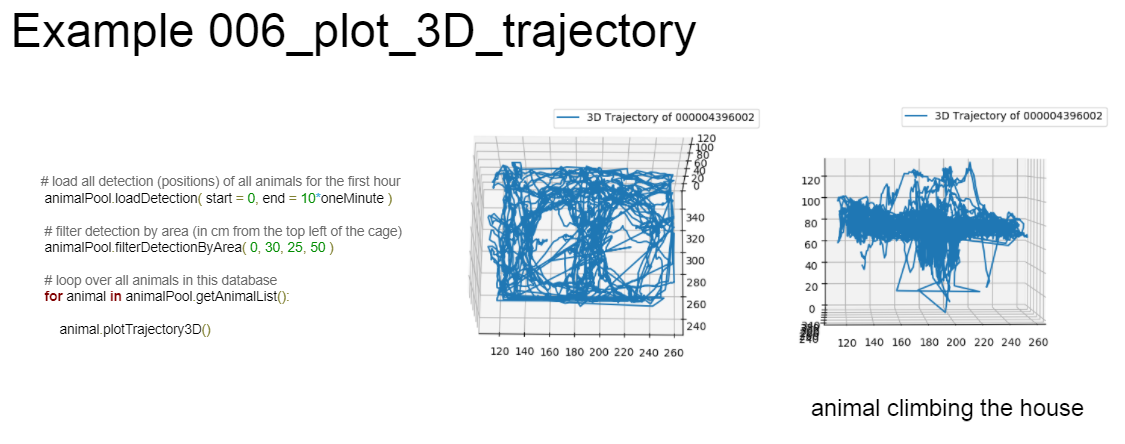
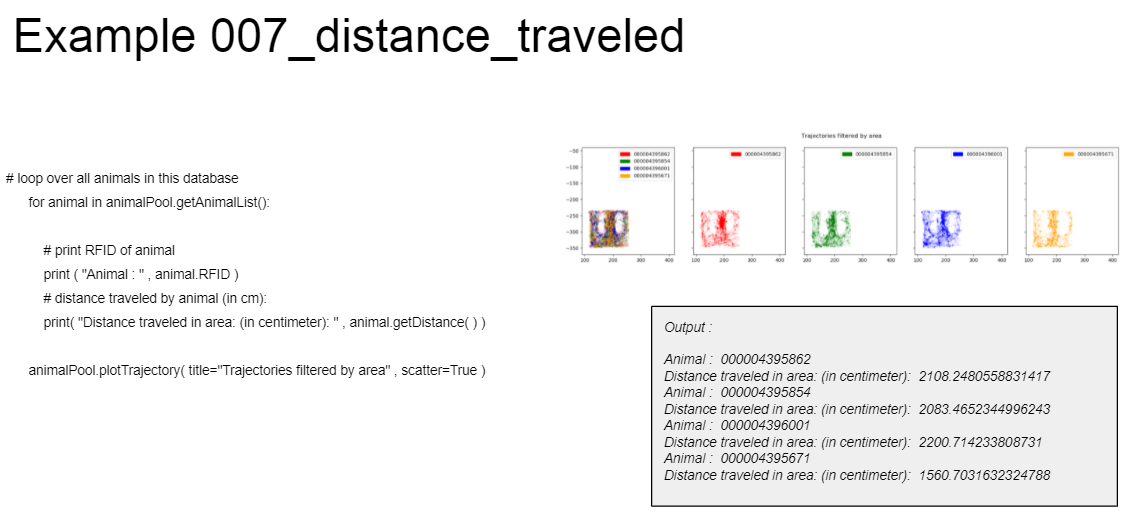
To perform the analysis, the LMT designers provide a Python framework detailed in this presentation. They also provide the code on GitHub. Examples of data analysis here which contains trajectory drawing, position extraction, event timeline extraction. You can also reconstruct all available events using this script. An example of interactive event exploration is also available here .
¶ Learning by examples
